Free calculator
DNA Percentage Calculator
Convert between shared percentage, centimorgans and relationship in any direction, and see why the observed value almost never lands on the textbook number.
Convert in any direction
Total used: 6,970 cMPercentage by relationship
| Relationship | Expected % | ≈ cM | Usual range |
|---|---|---|---|
| Identical twin | 100.00% | 6,900 | 6,700–7,100 |
| Parent / child | 50.00% | 3,485 | 3,485–3,485 |
| Full sibling | 50.00% | 2,594 | 1,916–3,154 |
| Half sibling | 25.00% | 1,718 | 908–2,546 |
| Grandparent / grandchild | 25.00% | 1,733 | 652–2,844 |
| Aunt/uncle — niece/nephew | 25.00% | 1,705 | 966–2,447 |
| Half aunt/uncle — half niece/nephew | 12.50% | 841 | 225–1,668 |
| Great-grandparent / great-grandchild | 12.50% | 851 | 166–1,773 |
| Great-aunt/uncle — great-niece/nephew | 12.50% | 835 | 259–1,728 |
| First cousin | 12.50% | 829 | 266–1,516 |
| Half great-aunt/uncle — half great-niece/nephew | 6.25% | 409 | 25–1,074 |
| 2nd great-grandparent / 2nd great-grandchild | 6.25% | 416 | 7–1,196 |
| 2nd great-aunt/uncle — 2nd great-niece/nephew | 6.25% | 406 | 34–1,055 |
| Half first cousin | 6.25% | 409 | 23–1,057 |
| First cousin once removed | 6.25% | 402 | 39–957 |
| 3rd great-grandparent / 3rd great-grandchild | 3.13% | 198 | 7–753 |
| Half first cousin once removed | 3.13% | 196 | 7–734 |
| First cousin twice removed | 3.13% | 193 | 7–673 |
| Second cousin | 3.13% | 194 | 7–677 |
| First cousin three times removed | 1.56% | 92 | 7–442 |
| Half second cousin | 1.56% | 93 | 7–462 |
| Second cousin once removed | 1.56% | 92 | 7–443 |
| Half second cousin once removed | 0.781% | 47 | 7–322 |
| Second cousin twice removed | 0.781% | 46 | 7–284 |
| Third cousin | 0.781% | 46 | 7–286 |
| Second cousin three times removed | 0.391% | 27 | 7–223 |
| Half third cousin | 0.391% | 28 | 7–240 |
| Third cousin once removed | 0.391% | 27 | 7–213 |
| Third cousin twice removed | 0.195% | 20 | 7–161 |
| Fourth cousin | 0.195% | 19 | 7–180 |
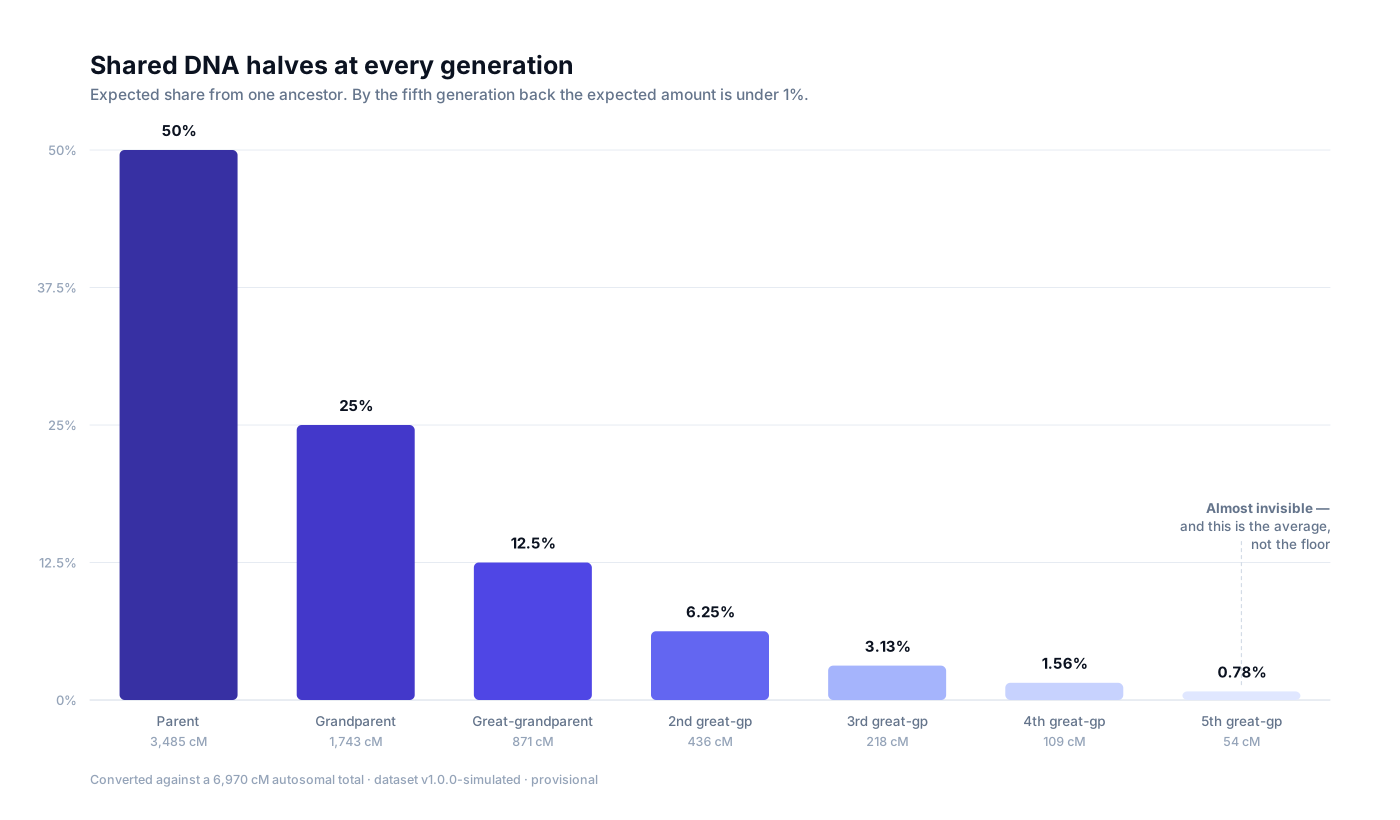
Why percentages mislead
A percentage feels precise, which is exactly the problem. The expected value is an average over many pairs of relatives; your pair is one draw from a distribution. Reporting "we share 3.1%, so we are second cousins" treats a single sample as if it were the mean. The honest sentence is "3.1% is consistent with second cousins, and with four other relationships".
Common questions
Why do different sites give slightly different percentages for the same relationship?
Because they divide by a different total. Testing companies measure between roughly 6,700 and 7,100 cM of autosomal DNA depending on the chip and the reference map they use, so the same shared segment converts to a slightly different percentage on each platform.
Is 50% from each parent exact?
For autosomal DNA, yes — that is the one number with no variation. Everything further back is a shuffle, which is why grandparent percentages are rarely a clean 25%.
Why is my sibling not exactly 50%?
Siblings inherit different halves of each parent's DNA. On average that works out to about half shared, but the shuffle means it can land meaningfully above or below. Companies also differ in how they count regions where both chromosomes match, which changes the reported figure.